| Wirtschaft / Wechselkurse |
SGD zu NOK Wechselkurse (Singapur-Dollar zum Norwegische Krone)
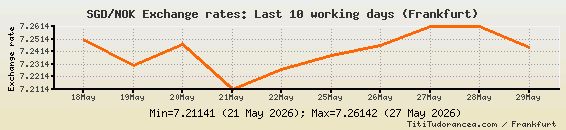
Letzte 10 Werktage
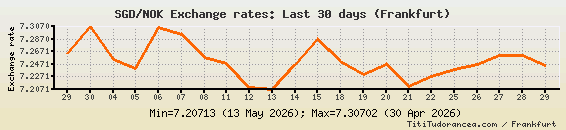
Letzte 30 Tage
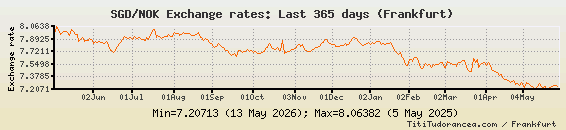
Letzte 365 Tage
SGD/NOK Wechselkurs - Historische Daten:
| Datum: | Wechselkurs: |
| 14.10.2026 | 7.38457 |
| 13.10.2026 | 7.45059 |
| 12.10.2026 | 7.47206 |
| 09.10.2026 | 7.46829 |
| 08.10.2026 | 7.4735 |
| 07.10.2026 | 7.48515 |
| 06.10.2026 | 7.48888 |
| 05.10.2026 | 7.49965 |
| 02.10.2026 | 7.53968 |
| 01.10.2026 | 7.52075 |
| 30.09.2026 | 7.51672 |
| 29.09.2026 | 7.4969 |
| 28.09.2026 | 7.4405 |
| 25.09.2026 | 7.44352 |
| 24.09.2026 | 7.41597 |
| 23.09.2026 | 7.40317 |
| 22.09.2026 | 7.39187 |
| 21.09.2026 | 7.3824 |
| 18.09.2026 | 7.37799 |
| 17.09.2026 | 7.39312 |
| 16.09.2026 | 7.34411 |
| 15.09.2026 | 7.34523 |
| 14.09.2026 | 7.33647 |
| 11.09.2026 | 7.33517 |
| 10.09.2026 | 7.31663 |
| 09.09.2026 | 7.26683 |
| 08.09.2026 | 7.30903 |
| 07.09.2026 | 7.32128 |
| 04.09.2026 | 7.33734 |
| 03.09.2026 | 7.33874 |
| 02.09.2026 | 7.33261 |
| 01.09.2026 | 7.3301 |
| 31.08.2026 | 7.33975 |
| 28.08.2026 | 7.33651 |
| 27.08.2026 | 7.34734 |
| 26.08.2026 | 7.34595 |
| 25.08.2026 | 7.3525 |
| 24.08.2026 | 7.33147 |
| 21.08.2026 | 7.3241 |
| 20.08.2026 | 7.33681 |
| 19.08.2026 | 7.36698 |
| 18.08.2026 | 7.37104 |
| 17.08.2026 | 7.38224 |
| 14.08.2026 | 7.39482 |
| 13.08.2026 | 7.44057 |
| 12.08.2026 | 7.4062 |
| 11.08.2026 | 7.42605 |
| 10.08.2026 | 7.4305 |
| 07.08.2026 | 7.42809 |
| 06.08.2026 | 7.43364 |
| 05.08.2026 | 7.41828 |
| 04.08.2026 | 7.44396 |
| 03.08.2026 | 7.43861 |
| 31.07.2026 | 7.41479 |
| 30.07.2026 | 7.42863 |
| 29.07.2026 | 7.47655 |
| 28.07.2026 | 7.48572 |
| 27.07.2026 | 7.47448 |
| 24.07.2026 | 7.41336 |
| 23.07.2026 | 7.44511 |
| 22.07.2026 | 7.43177 |
| 21.07.2026 | 7.4569 |
| 20.07.2026 | 7.48661 |
| 17.07.2026 | 7.47646 |
| 16.07.2026 | 7.48478 |
| 15.07.2026 | 7.52833 |
| 14.07.2026 | 7.5134 |
| 13.07.2026 | 7.55808 |