| Wirtschaft / Wechselkurse |
NOK zu MXN Wechselkurse (Norwegische Krone zum Mexikanischer Peso)
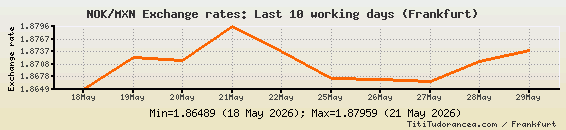
Letzte 10 Werktage
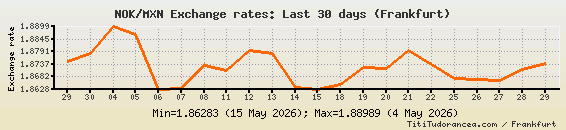
Letzte 30 Tage
Letzte 365 Tage
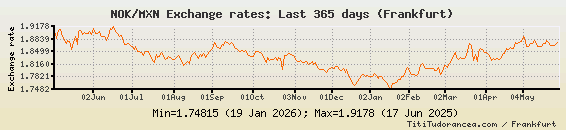
NOK/MXN Wechselkurs - Historische Daten:
| Datum: | Wechselkurs: |
| 14.10.2026 | 1.93898 |
| 13.10.2026 | 1.92273 |
| 12.10.2026 | 1.91745 |
| 09.10.2026 | 1.90332 |
| 08.10.2026 | 1.88006 |
| 07.10.2026 | 1.88794 |
| 06.10.2026 | 1.8762 |
| 05.10.2026 | 1.89029 |
| 02.10.2026 | 1.90007 |
| 01.10.2026 | 1.88737 |
| 30.09.2026 | 1.88796 |
| 29.09.2026 | 1.86897 |
| 28.09.2026 | 1.86866 |
| 25.09.2026 | 1.86177 |
| 24.09.2026 | 1.85252 |
| 23.09.2026 | 1.84275 |
| 22.09.2026 | 1.83064 |
| 21.09.2026 | 1.82681 |
| 18.09.2026 | 1.82113 |
| 17.09.2026 | 1.82297 |
| 16.09.2026 | 1.83272 |
| 15.09.2026 | 1.83562 |
| 14.09.2026 | 1.83152 |
| 11.09.2026 | 1.8255 |
| 10.09.2026 | 1.82855 |
| 09.09.2026 | 1.84107 |
| 08.09.2026 | 1.83219 |
| 07.09.2026 | 1.82432 |
| 04.09.2026 | 1.81794 |
| 03.09.2026 | 1.8285 |
| 02.09.2026 | 1.82103 |
| 01.09.2026 | 1.82132 |
| 31.08.2026 | 1.82079 |
| 28.08.2026 | 1.81709 |
| 27.08.2026 | 1.81716 |
| 26.08.2026 | 1.81512 |
| 25.08.2026 | 1.81447 |
| 24.08.2026 | 1.8174 |
| 21.08.2026 | 1.81909 |
| 20.08.2026 | 1.82038 |
| 19.08.2026 | 1.8121 |
| 18.08.2026 | 1.81069 |
| 17.08.2026 | 1.80515 |
| 14.08.2026 | 1.79823 |
| 13.08.2026 | 1.79041 |
| 12.08.2026 | 1.80115 |
| 11.08.2026 | 1.80111 |
| 10.08.2026 | 1.80395 |
| 07.08.2026 | 1.80304 |
| 06.08.2026 | 1.81011 |
| 05.08.2026 | 1.8106 |
| 04.08.2026 | 1.81098 |
| 03.08.2026 | 1.81689 |
| 31.07.2026 | 1.82336 |
| 30.07.2026 | 1.81931 |
| 29.07.2026 | 1.80825 |
| 28.07.2026 | 1.80482 |
| 27.07.2026 | 1.80998 |
| 24.07.2026 | 1.82653 |
| 23.07.2026 | 1.81607 |
| 22.07.2026 | 1.81572 |
| 21.07.2026 | 1.80766 |
| 20.07.2026 | 1.80982 |
| 17.07.2026 | 1.81109 |
| 16.07.2026 | 1.80612 |
| 15.07.2026 | 1.79173 |
| 14.07.2026 | 1.80181 |
| 13.07.2026 | 1.79054 |