| Wirtschaft / Wechselkurse |
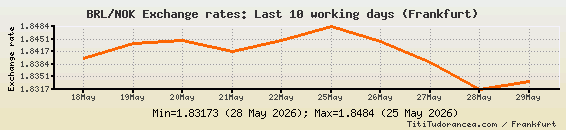
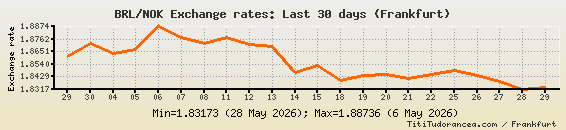
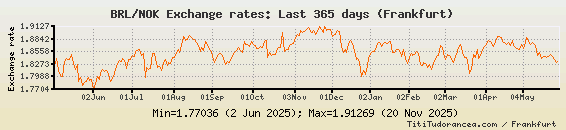
BRL zu NOK Wechselkurse (Brasilianischer Real zum Norwegische Krone)
Letzte 10 Werktage
Letzte 30 Tage
Letzte 365 Tage
BRL/NOK Wechselkurs - Historische Daten:
| Datum: | Wechselkurs: |
| 14.10.2026 | 1.8852 |
| 13.10.2026 | 1.90085 |
| 12.10.2026 | 1.9161 |
| 09.10.2026 | 1.91055 |
| 08.10.2026 | 1.90973 |
| 07.10.2026 | 1.91446 |
| 06.10.2026 | 1.92495 |
| 05.10.2026 | 1.92618 |
| 02.10.2026 | 1.84806 |
| 01.10.2026 | 1.85517 |
| 30.09.2026 | 1.8453 |
| 29.09.2026 | 1.83745 |
| 28.09.2026 | 1.82763 |
| 25.09.2026 | 1.83446 |
| 24.09.2026 | 1.83214 |
| 23.09.2026 | 1.84397 |
| 22.09.2026 | 1.83922 |
| 21.09.2026 | 1.8352 |
| 18.09.2026 | 1.83657 |
| 17.09.2026 | 1.8377 |
| 16.09.2026 | 1.81722 |
| 15.09.2026 | 1.81443 |
| 14.09.2026 | 1.80764 |
| 11.09.2026 | 1.81968 |
| 10.09.2026 | 1.80814 |
| 09.09.2026 | 1.80408 |
| 08.09.2026 | 1.81014 |
| 07.09.2026 | 1.80845 |
| 04.09.2026 | 1.81862 |
| 03.09.2026 | 1.8336 |
| 02.09.2026 | 1.81253 |
| 01.09.2026 | 1.79545 |
| 31.08.2026 | 1.80618 |
| 28.08.2026 | 1.80612 |
| 27.08.2026 | 1.8165 |
| 26.08.2026 | 1.81242 |
| 25.08.2026 | 1.81072 |
| 24.08.2026 | 1.8087 |
| 21.08.2026 | 1.79575 |
| 20.08.2026 | 1.79714 |
| 19.08.2026 | 1.80655 |
| 18.08.2026 | 1.80861 |
| 17.08.2026 | 1.80847 |
| 14.08.2026 | 1.82595 |
| 13.08.2026 | 1.83838 |
| 12.08.2026 | 1.83727 |
| 11.08.2026 | 1.86225 |
| 10.08.2026 | 1.86951 |
| 07.08.2026 | 1.86567 |
| 06.08.2026 | 1.86011 |
| 05.08.2026 | 1.8584 |
| 04.08.2026 | 1.87896 |
| 03.08.2026 | 1.88122 |
| 31.07.2026 | 1.88347 |
| 30.07.2026 | 1.87508 |
| 29.07.2026 | 1.88749 |
| 28.07.2026 | 1.89234 |
| 27.07.2026 | 1.89764 |
| 24.07.2026 | 1.88289 |
| 23.07.2026 | 1.89572 |
| 22.07.2026 | 1.88907 |
| 21.07.2026 | 1.89441 |
| 20.07.2026 | 1.89328 |
| 17.07.2026 | 1.88704 |
| 16.07.2026 | 1.89718 |
| 15.07.2026 | 1.91462 |
| 14.07.2026 | 1.89574 |
| 13.07.2026 | 1.9096 |